Entire Sweden listed on Airbnb triggers the growth of online search volume
The case of Visit Sweden proves that being visible online among other accommodations can massively improve the digital identity of a country. In 2017, Visit Sweden launched a marketing campaign with the aim of sharing Swedish nature and the unique possibilities available to spend time there.
Let’s see how Visit Sweden measured the results of their campaign and how they leveraged D2 – Digital Demand © software data in order to understand its impact beyond PR by measuring brand audiences’ willingness to search for information online about Sweden.
Sweden's marketing campaign “Freedom to Roam”.
Did you know that in Sweden everyone can go into nature and fully experience everything it has to offer? The “Allemansrätten” – freedom to roam – is a right that allows people in Sweden to move about freely in nature – eating berries from the ground, picking mushrooms, sleeping under the stars, swimming in the lakes during summer or skating on lake ice in the winter. In other words, Swedish nature is just like a regular home for Swedes. The Swedish tourism marketing team (Visit Sweden) decided to take advantage of this fact and listed the entire country on Airbnb.
To spread the word and give people worldwide the opportunity to experience this, in May 2017, Visit Sweden listed the entire country on Airbnb. Saying that, for example, the mysterious forest offers high-quality accommodation and a memorable stay. It allows tourists to enjoy natural cuisine, mushrooms and berries from August to November. Besides, accommodation includes an outside bedroom and a natural bed type.
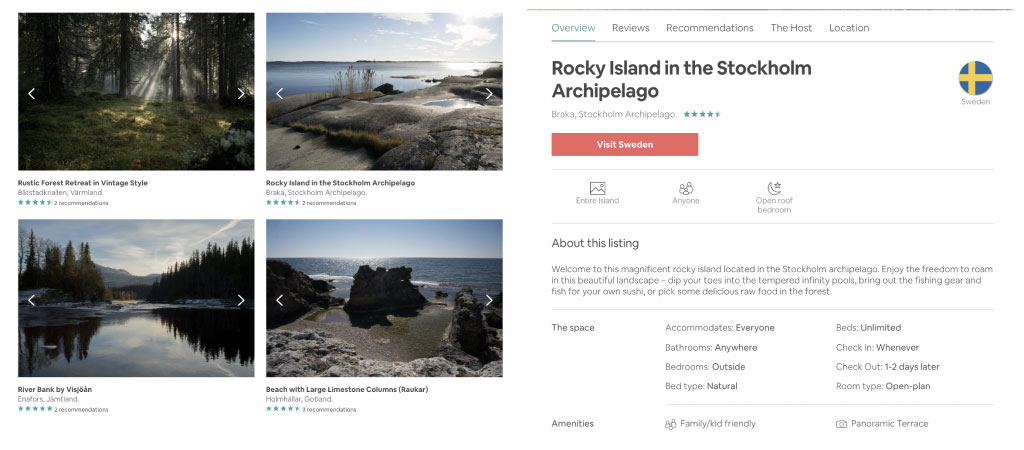
D2 - Digital Demand ©: Search volume analyses for the Visit Sweden campaign.
From 2015 through 2019 Visit Sweden had access to D2 – Digital Demand © data, using it for strategy measurement. The data allowed Visit Sweden to understand the impact of specific campaigns, including the Freedom to Roam campaign.
The overall impact on the search volume.
In order to analyse the campaign, the data from the year of the campaign was compared with the previous year to qualify its net impact, adjusting and subtracting the organic growth effect. In this case, Visit Sweden analysed one specific micro-brandtag* and D2 – Digital Demand © data revealed the respective impact on search volume towards Sweden.
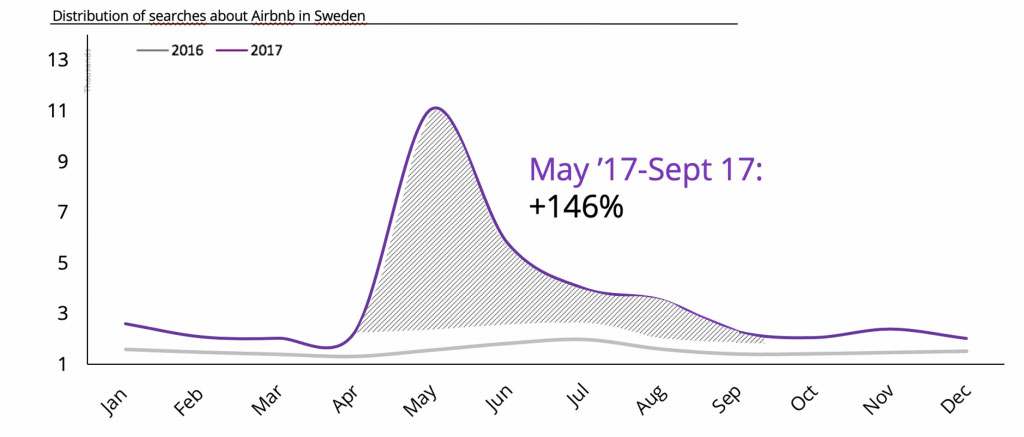
The campaign more than doubled the searches about Airbnb in Sweden. As you can see in the graph below, the curve illustrates how global online searches about Airbnb in Sweden significantly increased during the last year compared to the previous year.
In the seasonality graph, you can see the distribution of searches about Airbnb in Sweden by month. This way it is possible to compare precisely each period of the campaign to the exact same time period of the previous year.
It is clear that the shaded area from May 2017 to September 2017 compared to the same period in 2016 searches have significantly increased, growing by 146%.
The impact differs by market.
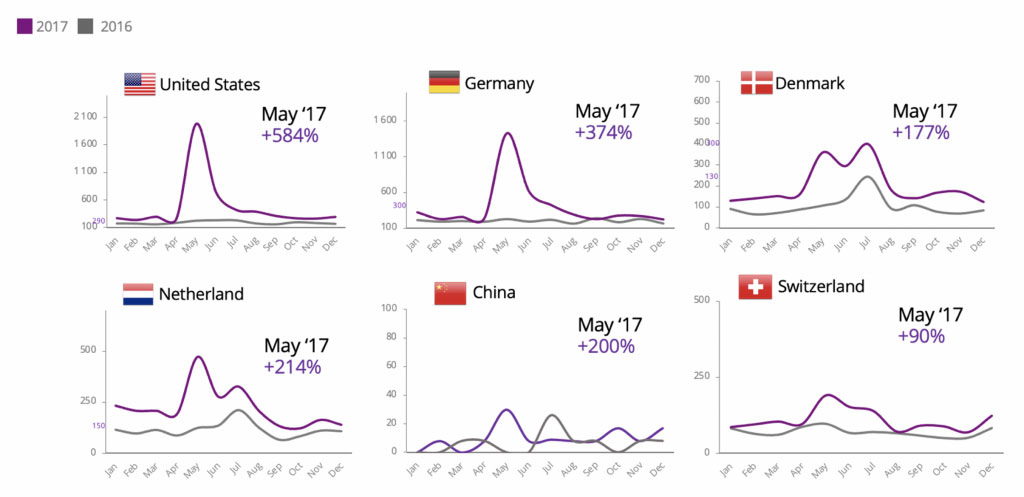
The D2 – Digital Demand © software allows us to understand individual markets. As we can see in the graphs below, when taking a closer look, data differs across countries analysed. While searches in the USA and Germany spiked, in countries like China and Switzerland you can see a relatively low level of impact between the observed time periods.
At the same time, in neighbouring countries such as Denmark and the Netherlands, search volume was organically higher even before the campaign. Therefore, they experienced lower levels of impact during the campaign, seeing a jump in search volume by approximately 200%.
A percentage is not always the key, as in the case of China where the number of searches increased by 200% in May 2017 compared to May 2016. Overall, throughout the year, search volume fluctuated leaving no evidence of the impact of the campaign.
Do results speak to the success of the campaign?
Overall, we saw positive results during the Airbnb campaign and a great impact on the level of Airbnb searches. However, data does not reveal the long-term impact beyond the campaign.
Through this initiative, we can see who are the key target markets by a show of striking interest. As was shown above, markets like the United States and Germany spiked, while others showed little change like China and Switzerland.
This example of Visit Sweden campaign measurement is an excellent representation of how we use our proprietary software D2 – Digital Demand © in order to measure the impact of specific marketing activity and assess its results.
Congratulations to Visit Sweden on a truly influential campaign that has drawn the attention of people from around the globe. Keep up the good work!
*Micro-brandtags are a cluster of keywords related to a specific topic, D2 – Digital Demand © software gives access to all possible micro-brandtags related to a specific country, region, or city.
Let us know if you’re interested in scheduling a conference call with us and seeing how D2 – Digital Demand © digital search analytics software works in action: hello@d2analytics.io or +371 62102353.
Other D2 - Analytics news and stories, you might be interested in:
April 25, 2021
Introducing NEW tool: D2 – Crisis Mode
April 8, 2021
D2 – Digital Demand ©, results may surprise you
January 4, 2021
Who’s managing the Digital Identity of nations and places?
May 27, 2020
New studies: Covid-19 impact on destinations
December 15, 2019
NEW product: D2 – Digital Supply software
September 23, 2017
New: D2 – Live Quanti software
March 12, 2015

